Building a Polymarket Trader Explorer with the Struct SDK
How we built a Polymarket trader explorer - a real-time analytics dashboard with PnL charts, heatmap calendars, shareable image cards, and streaming SSR. Architecture, key decisions, and implementation details.

What we built
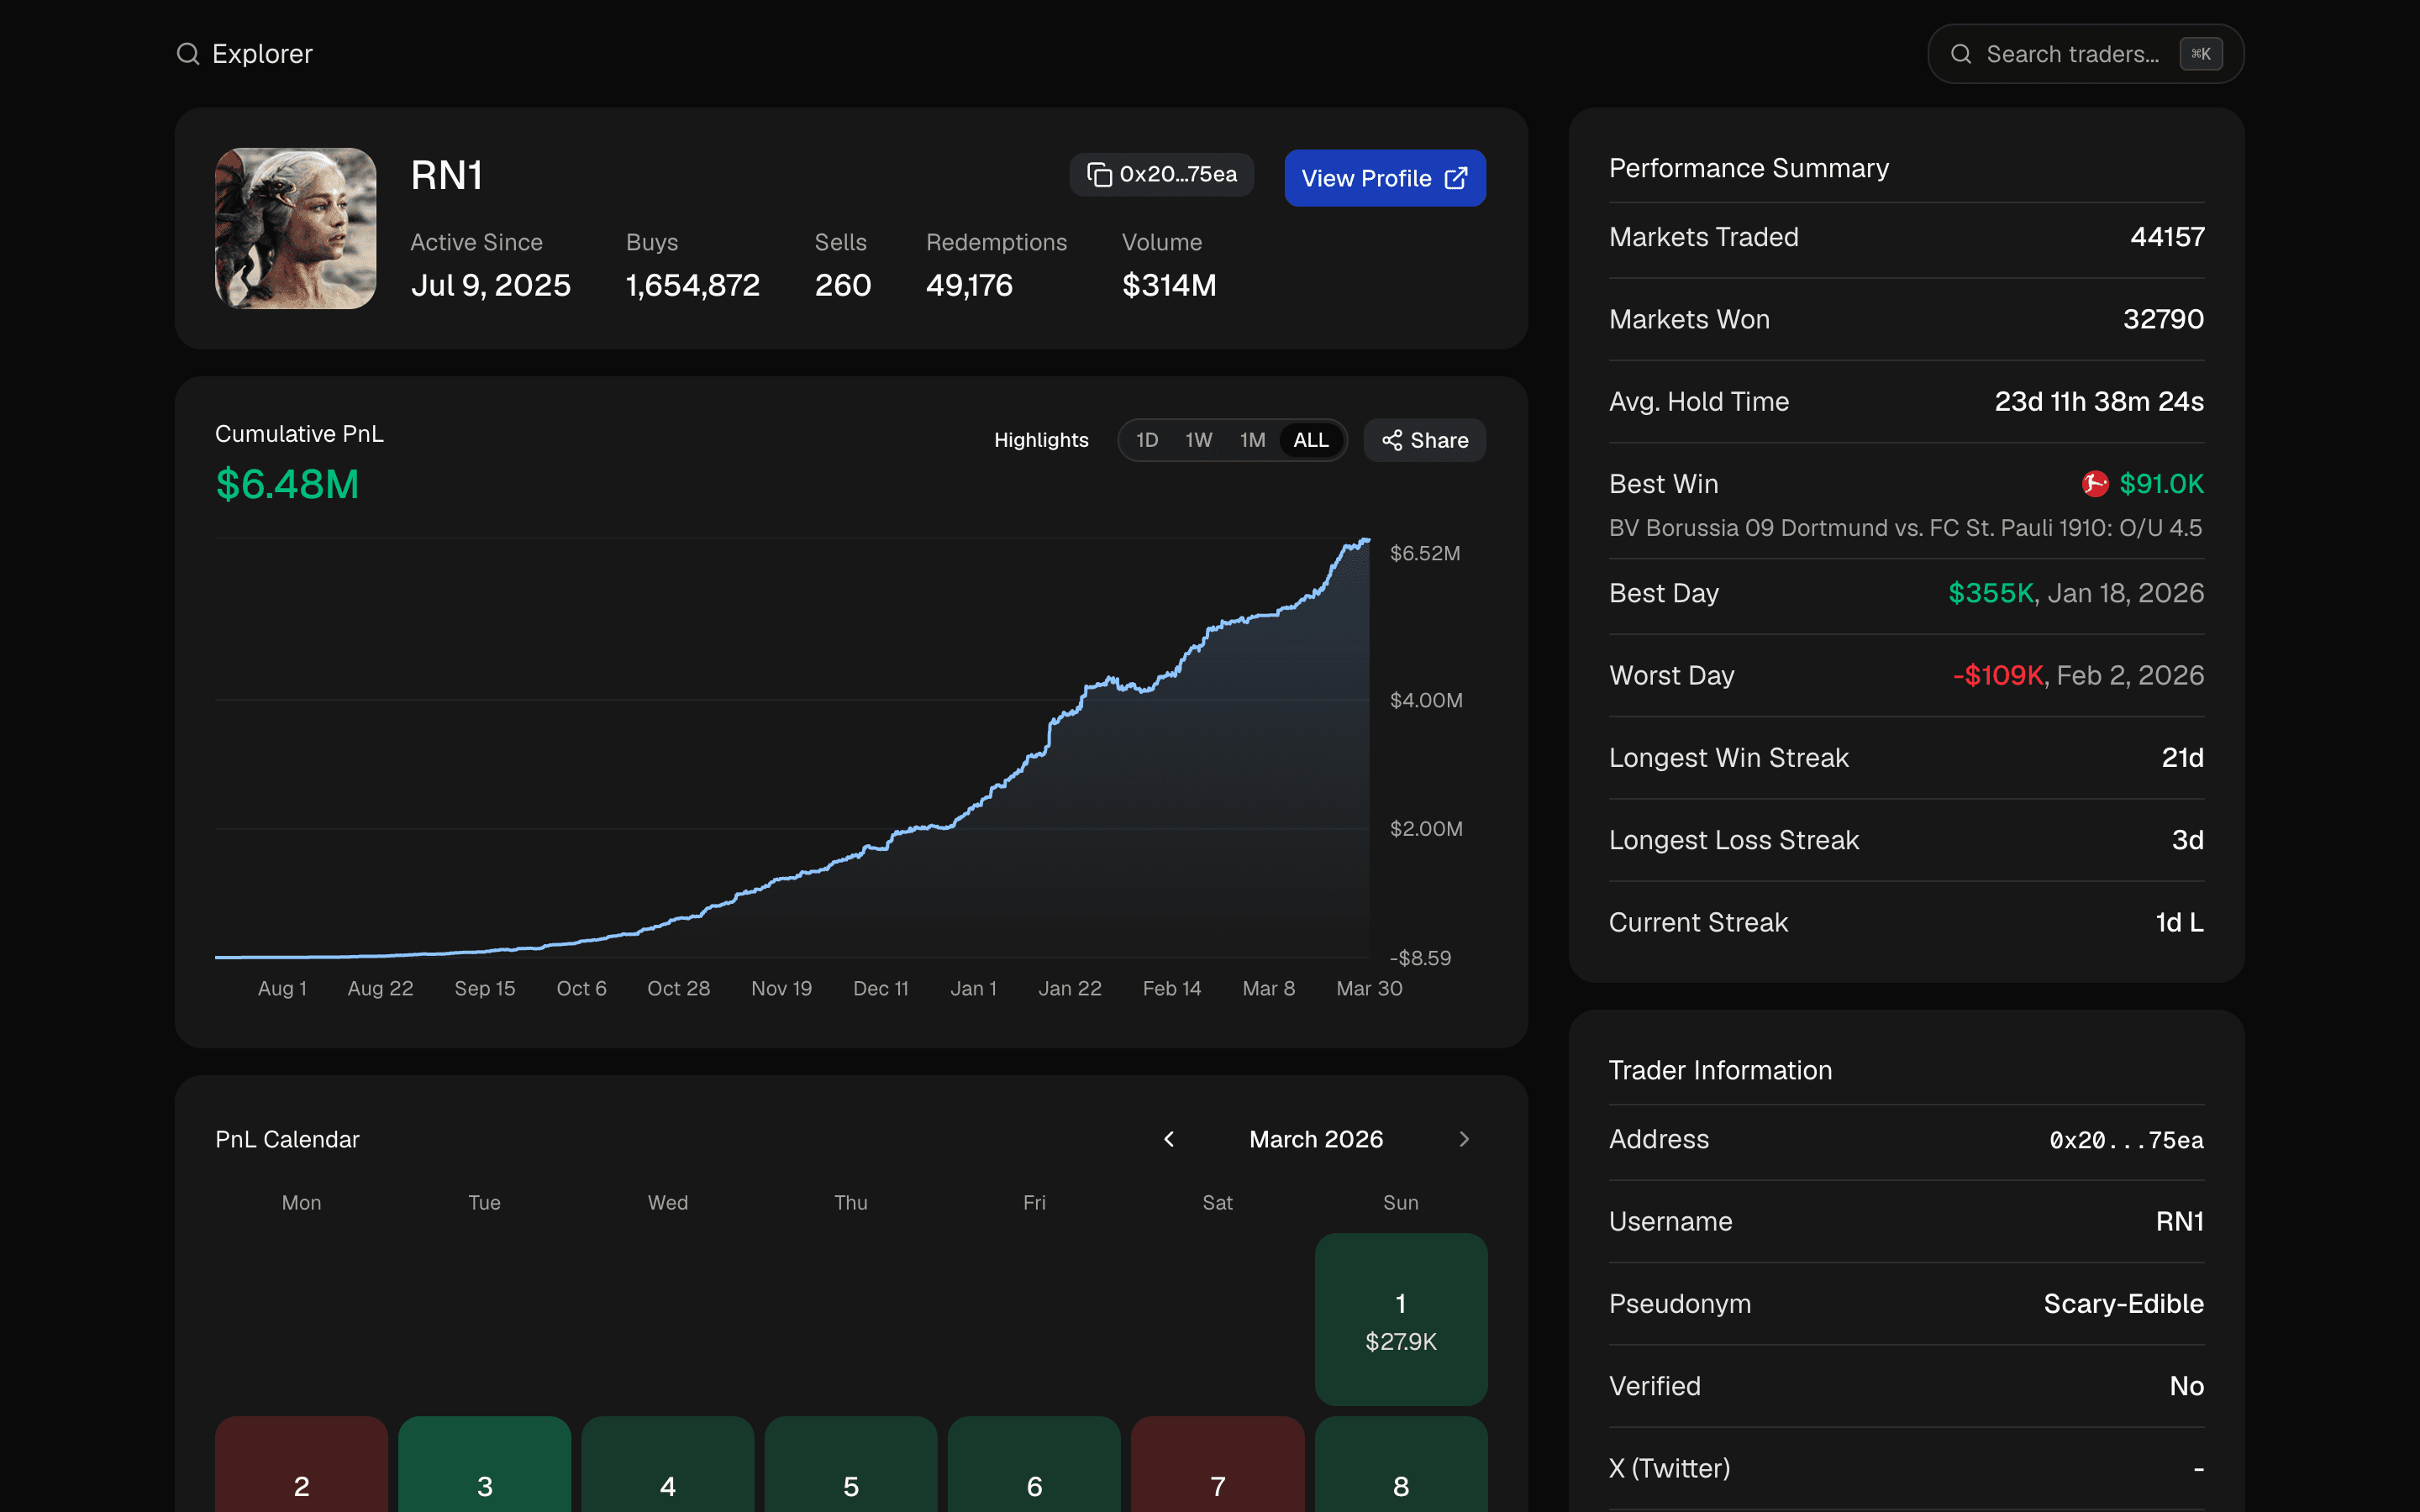
We built a Polymarket trader explorer - a real-time analytics dashboard that lets you search any Polymarket trader by name or wallet address and get a full breakdown of their performance. PnL charts with best/worst day annotations, a daily profit heatmap calendar, open and closed positions, trade history, performance streaks, and a shareable PnL image card you can download or copy to clipboard.
It's a Next.js 16 app with streaming SSR, and it needs exactly one environment variable: your Struct API key. No database. No auth. The data layer combines the Struct SDK for trader data with Polymarket's public APIs for chart rendering.
This article walks through the architecture, the interesting implementation details, and the decisions we made. If you want to build a trading dashboard, a portfolio tracker, or any analytics tool on top of Polymarket data, the same patterns apply.
The trader page
The trader page pulls data from five different endpoints in parallel. These requests are independent, so we fire them all at once as promises and pass them into async server components wrapped in Suspense. No await before the JSX - the browser gets the shell immediately, and content streams in as each promise resolves.
Struct SDK
The Struct SDK provides the primary data layer - trader profiles, PnL summaries, positions (open and closed), trade history, and market metadata. Each query wraps the SDK call with Next.js unstable_cache for 5-minute ISR revalidation and handles 404s gracefully by returning null instead of throwing.
The pattern is consistent across all five query functions: get the singleton client, guard against empty inputs, call the SDK, and let unexpected errors bubble up to the nearest error boundary.
Polymarket public APIs
For PnL chart data, we go directly to Polymarket's public PnL API instead of using the Struct SDK's PnL APIs. The reason comes down to how PnL is calculated. Struct's PnL data tracks realized profit only - closed positions where you've actually locked in a gain or loss. Polymarket's PnL API combines both realized and unrealized profit, reflecting the current value of open positions at live market prices. For an analytics dashboard where users want to see their total portfolio performance, the combined view is the right choice - a trader sitting on $50k in unrealized gains should see that in their chart, not just the trades they've closed.
The API accepts an interval parameter for time range (1d, 1w, 1m, all) and fidelity for granularity (5m, 1h, 3h, 1d). We map UI timeframe selections to these parameters through a lookup table, so switching from "1 Week" to "All Time" swaps both the range and the resolution in one click.
The weekly leaderboard on the homepage comes from Polymarket's public leaderboard API - top traders ranked by weekly PnL.
PnL chart with annotations
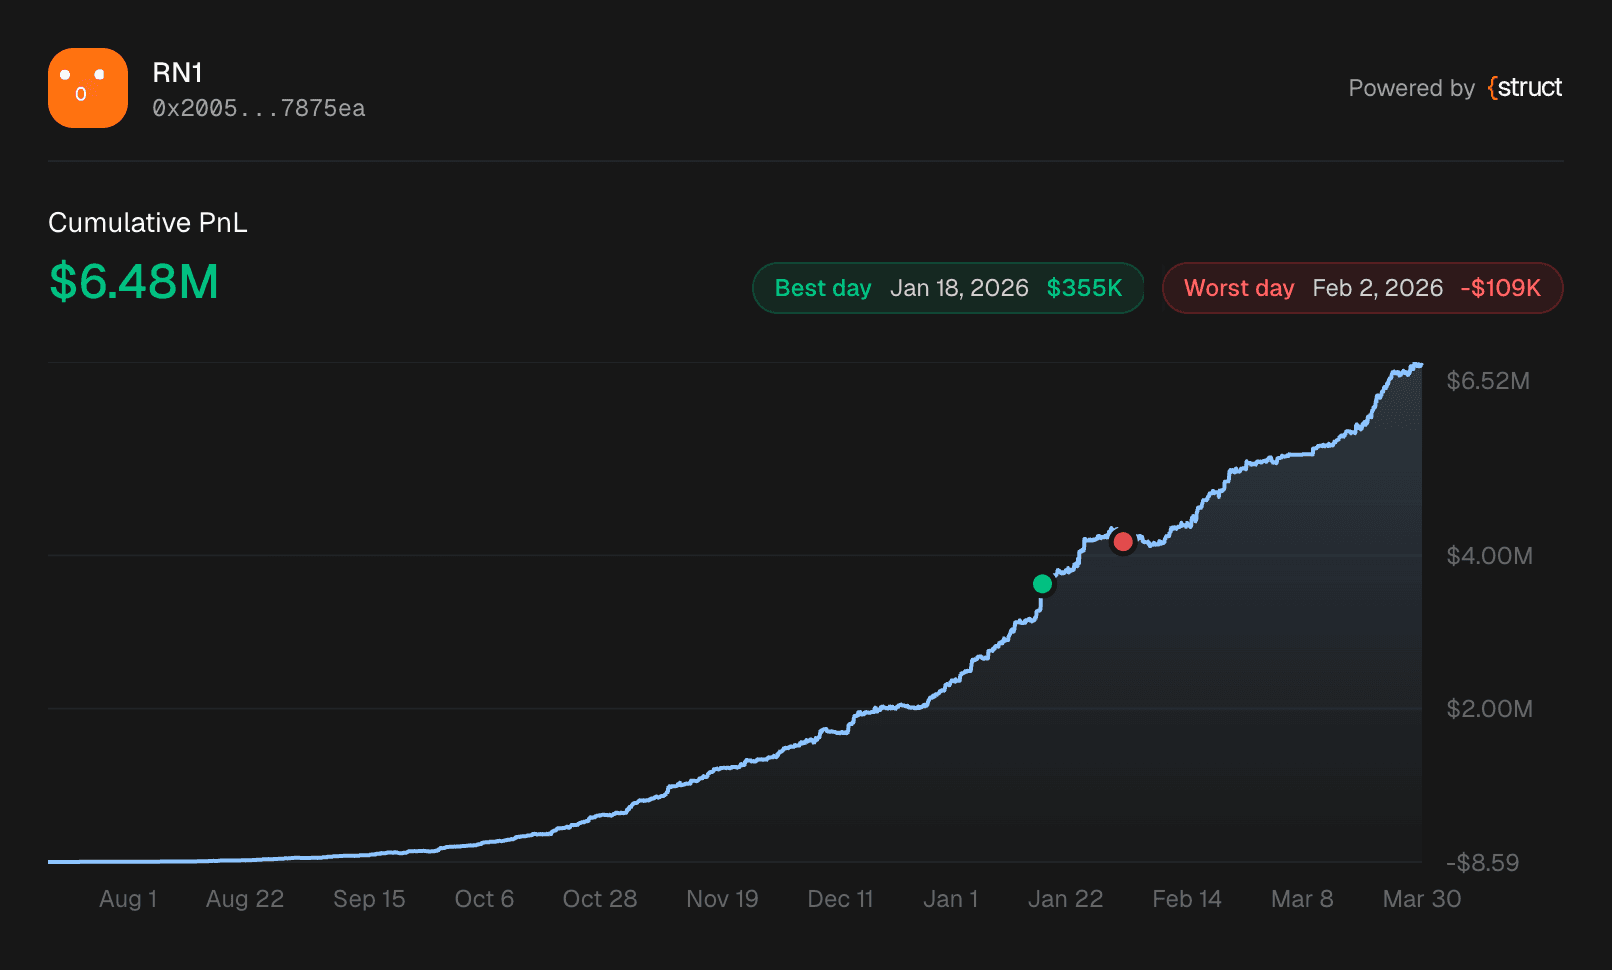
The PnL chart renders cumulative profit/loss as a Recharts area chart with gradient fills and interactive tooltips. The interesting part is the annotation system - on the all-time view, we compute the best and worst trading days and overlay them as reference dots directly on the chart.
Computing streaks
We derive streaks, best/worst days, and chart annotations server-side from daily PnL data. A single pass through the daily entries tracks the longest consecutive winning streak, longest losing streak, current streak direction, and the best and worst individual days by dollar amount.
The annotation function then maps those best/worst days back to the hourly candle data to find the exact cumulative PnL value at that timestamp. This gives us the Y coordinate for the reference dot on the chart - it sits precisely where that day's trading ended on the cumulative curve.
Each annotation renders as a Recharts ReferenceDot with a custom shape and a badge showing the date and daily P&L. Green for best days, red for worst. Users can toggle their visibility, and they only appear on the all-time view since they reference lifetime records.
The chart supports switching between 1D, 1W, 1M, and All timeframes. Timeframe state lives in the URL via nuqs, so links with a specific timeframe are shareable and the browser back button works as expected.
PnL calendar heatmap
Below the chart sits a daily PnL calendar - a grid of days color-coded by profit and loss, similar to GitHub's contribution graph.
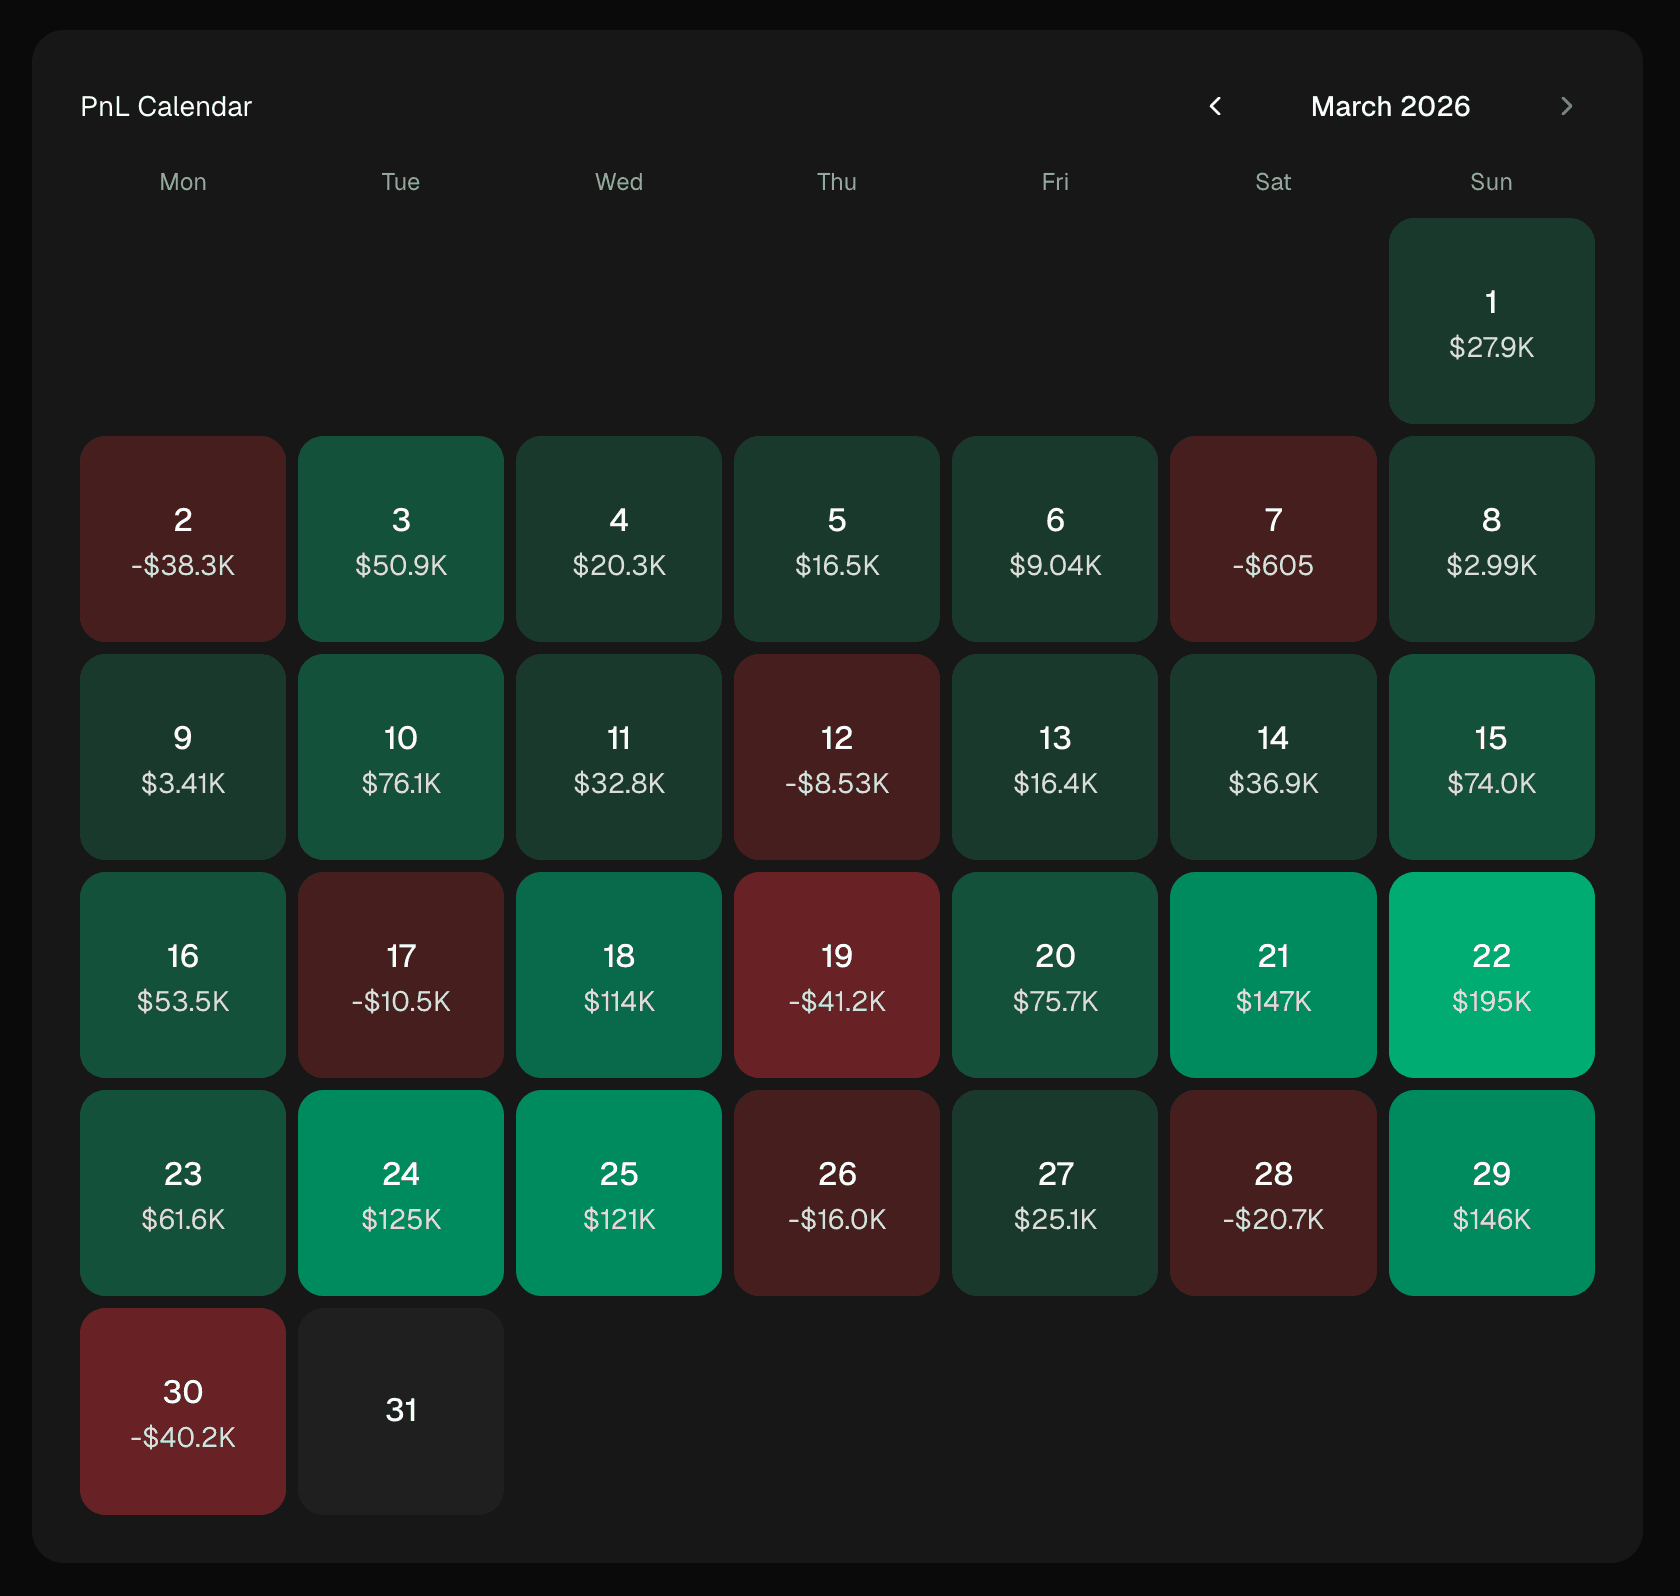
Each cell's color intensity is proportional to its P&L magnitude relative to the trader's typical day. We calculate the max absolute P&L across all days (excluding the all-time best and worst), then assign five tiers of opacity for both green and red. The best and worst days of all time get solid colors and are excluded from the scale so they don't compress the range for normal days.
The calendar handles input differently based on device. On desktop, hovering a cell shows a tooltip with the exact amount and date. On touch devices, we detect (hover: none) and (pointer: coarse) via matchMedia (no user agent sniffing) and render cells as tappable buttons instead. Tapping a day selects it and shows the details in a summary bar below the grid.
Month navigation lets you scroll back through a trader's full history with prev/next buttons, disabled when you reach the current month.
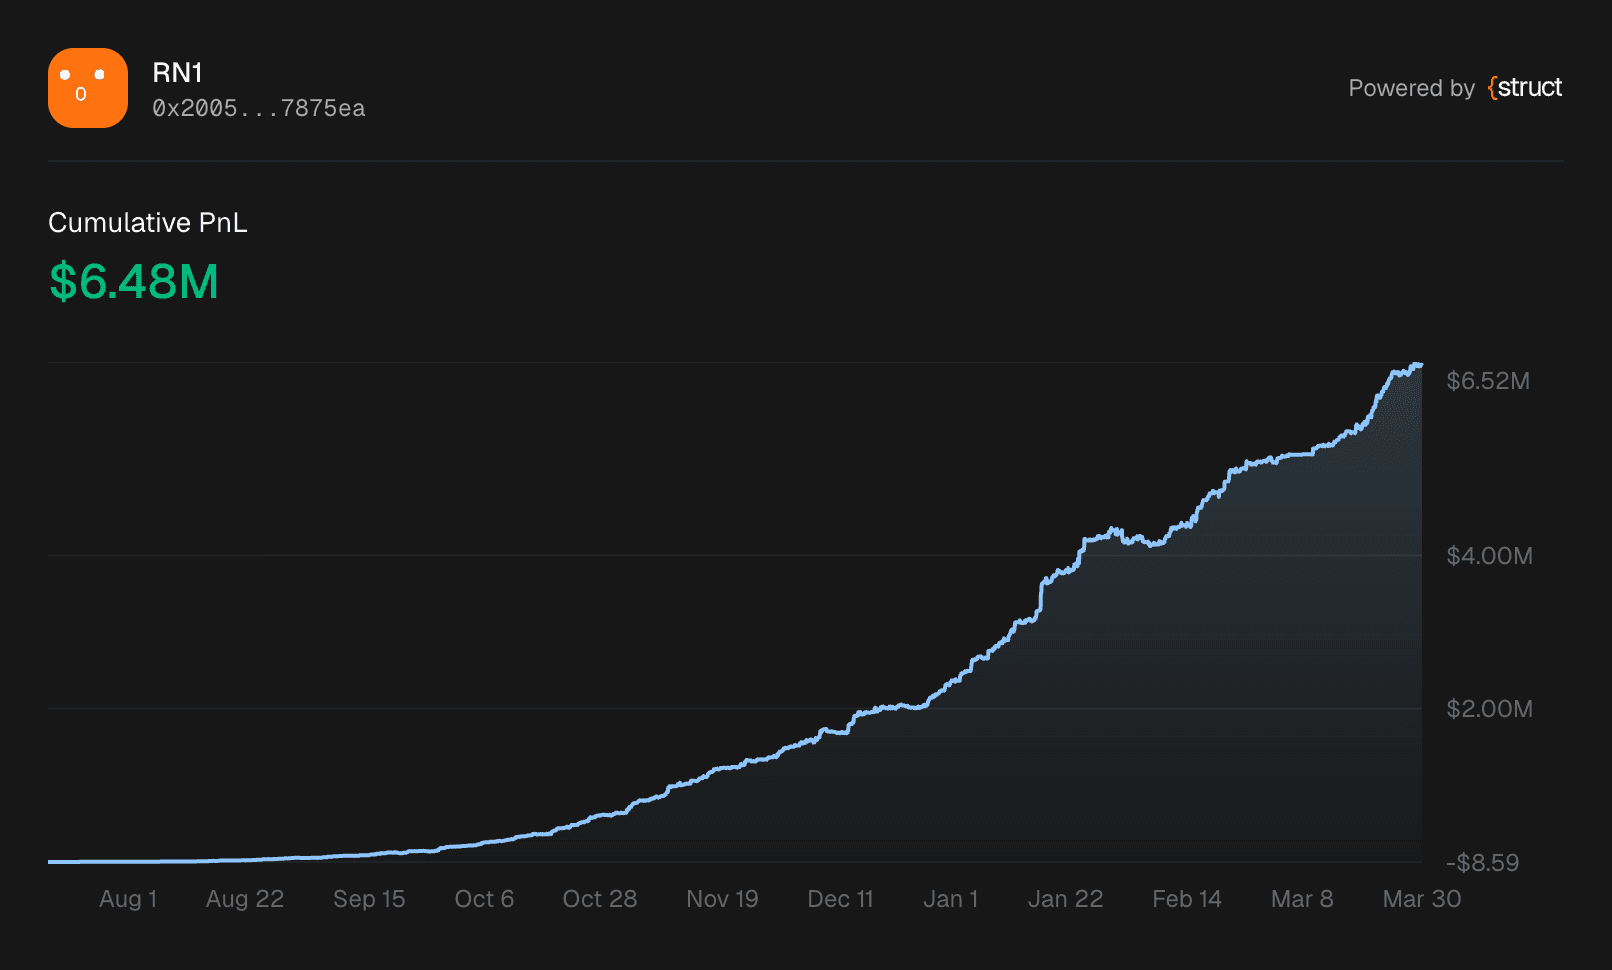
Share PnL card as image
The share feature lets users export the PnL chart card as a high-DPI PNG - either downloaded as a file or copied directly to clipboard.
The clone-and-capture approach
Capturing a live DOM node directly would include interactive buttons, hover states, and layout artifacts. Instead, we clone the target element into an off-screen container, apply share-specific styling via a data-share-mode="image" attribute, and capture the clone with html-to-image.
CSS selectors throughout the PnL card component use group-data-[share-mode=image] to conditionally hide interactive controls (timeframe buttons, share button) and show annotation badges inline instead of in a collapsible panel. The live UI is never affected.
A few other details that matter for quality output:
- SVG label swap - Recharts renders custom labels as HTML
foreignObjectelements, whichhtml-to-imagecan't capture reliably. The chart renders both HTML labels (visible in the browser) and hidden SVG<text>labels. During capture, the clone swaps their visibility. - High DPI - We enforce a minimum 2x pixel ratio for crisp output on retina displays.
- Font embedding -
html-to-imageinlines the Geist font into the PNG so it renders correctly when shared outside the app. - Background resolution - We walk up the DOM tree to find the first non-transparent background color, so the PNG never has a transparent or black background.
The share dialog previews the generated image and offers two actions: copy to clipboard (using the Clipboard API's ClipboardItem) and download as PNG with an auto-generated filename based on the trader's name.
Tab prefetching
The trader page has three tabs: Open positions, Closed positions, and Activity. Each tab triggers a server-side data fetch. To make switching feel instant, we prefetch the other tabs in the background.
The prefetching is layered for performance:
- Wait for page load - Don't compete with the initial render
- Wait for idle - Use
requestIdleCallback(with asetTimeoutfallback) so prefetching doesn't block user interactions - Stagger requests - 250ms delay between each tab to avoid request bursts
- Check network conditions - Skip prefetching entirely on 2G connections or when the browser's
saveDataflag is set - Deduplicate - Module-level
Sets track prefetched URLs and component bundles so nothing is fetched twice
On top of the background prefetch, hovering or focusing a tab trigger triggers an immediate prefetch. Between the two strategies, tab switches almost always hit warm caches.
Positions and activity tables
The Open and Closed tabs render paginated tables using TanStack Table. Each row shows the market image, title, outcome, share amounts, entry price, and PnL.
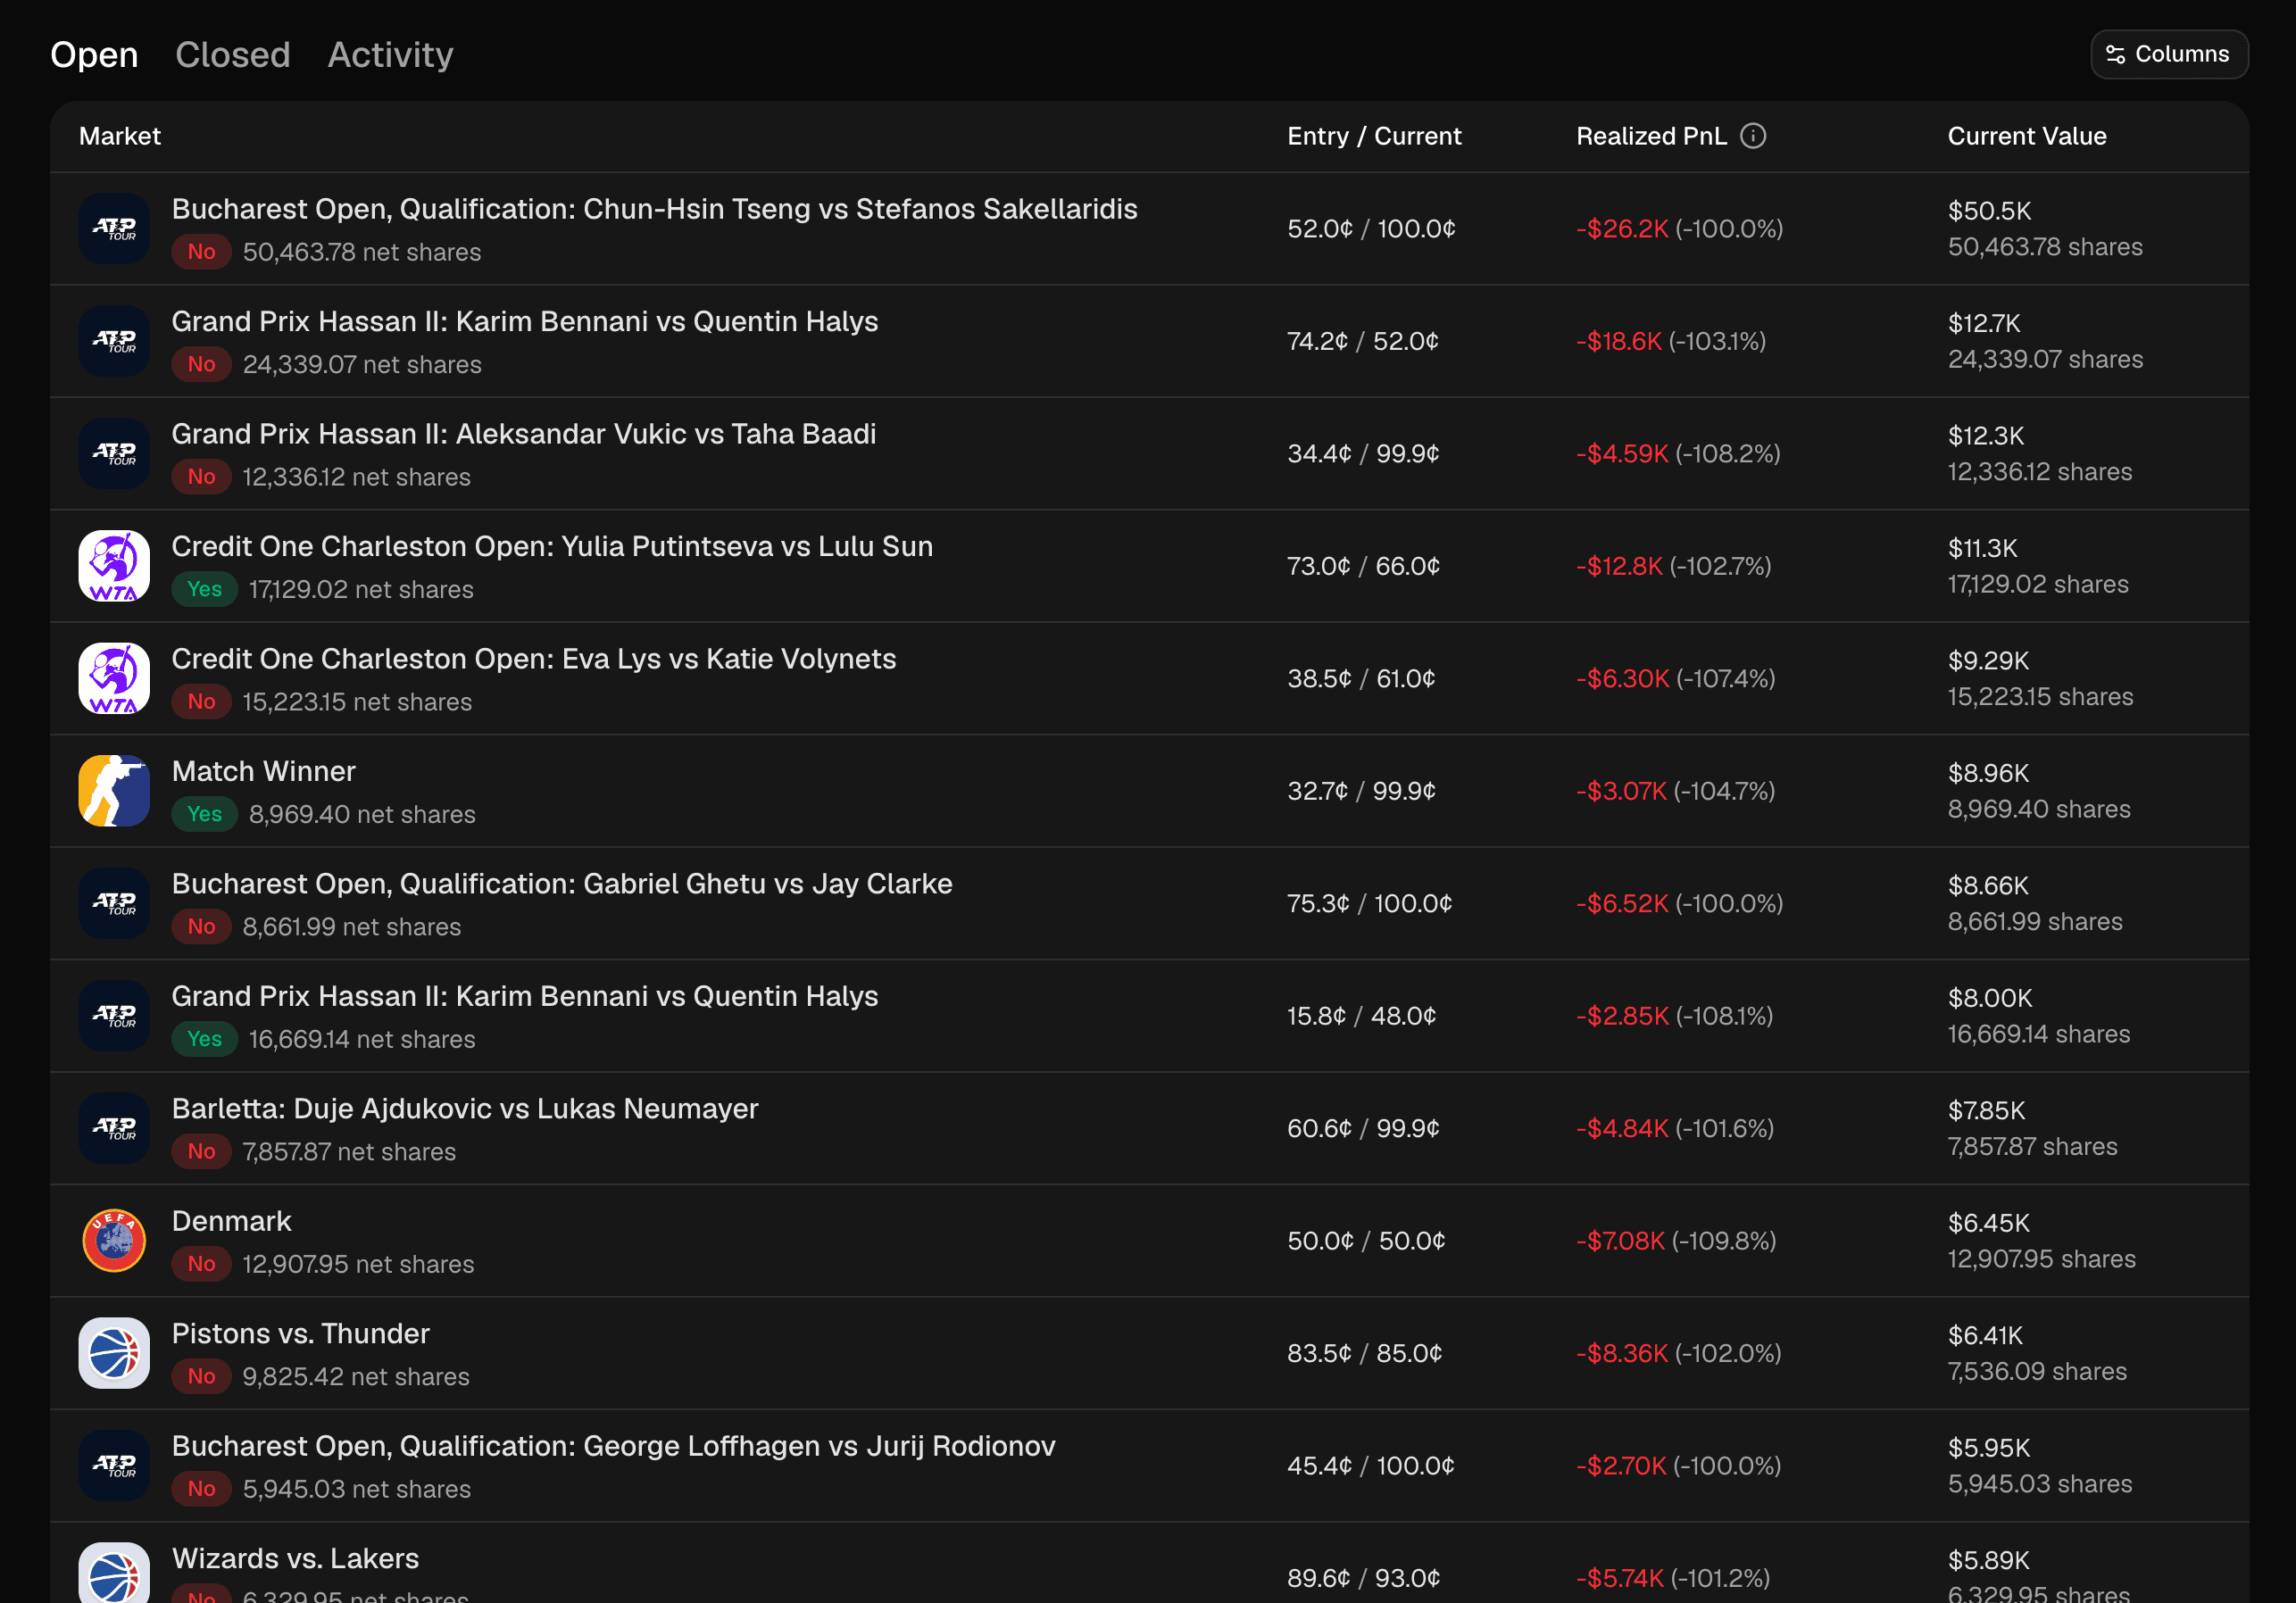
Pagination uses a simple limit + 1 pattern: request one extra row beyond the page size and check if it exists to determine whether there's a next page. No count queries, no estimations. The current tab, page numbers, and sort state all live in URL query parameters via nuqs, so browser navigation and shareable links work out of the box.
The Activity tab follows the same pattern for trade history - paginated with timestamps, trade types (buy, sell, redemption), share amounts, prices, and links to Polygonscan for each transaction.
Search
Search is powered by the Struct SDK's full-text search, exposed through a Next.js server action. A Cmd+K shortcut (Ctrl+K on Windows) opens a dialog that searches traders by name or username.
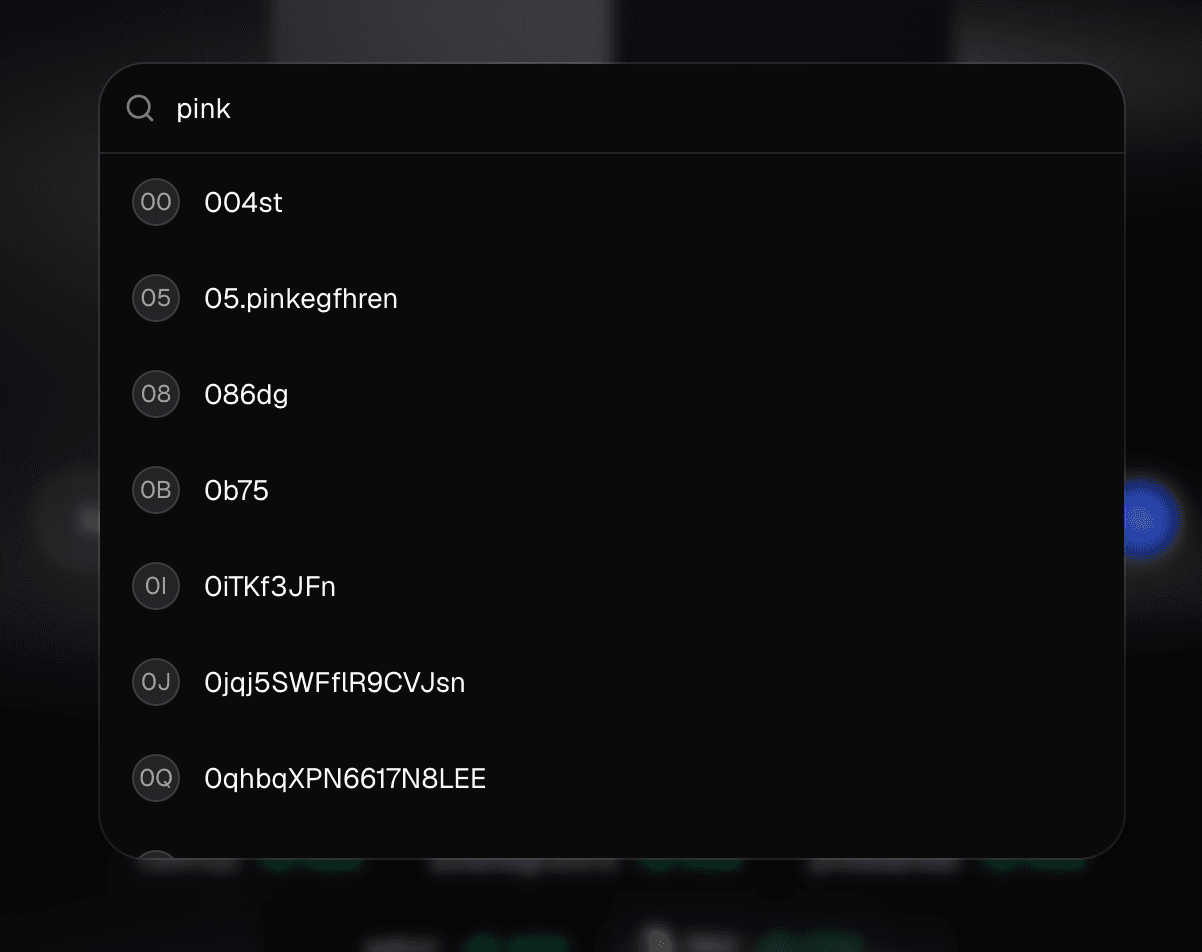
The input is debounced at 300ms and requires at least 2 characters before firing. React's cache() deduplicates identical queries within the same render pass, and client-side result caching prevents redundant server round-trips when the user backspaces through previous queries. Pasting a wallet address (0x format) bypasses search entirely and navigates directly to the trader page.
Weekly leaderboard
The homepage displays the top 10 traders ranked by weekly PnL. Each card shows the trader's avatar (or a deterministic Facehash avatar for traders without profile images), name, and weekly profit. Clicking any card navigates to their full profile.
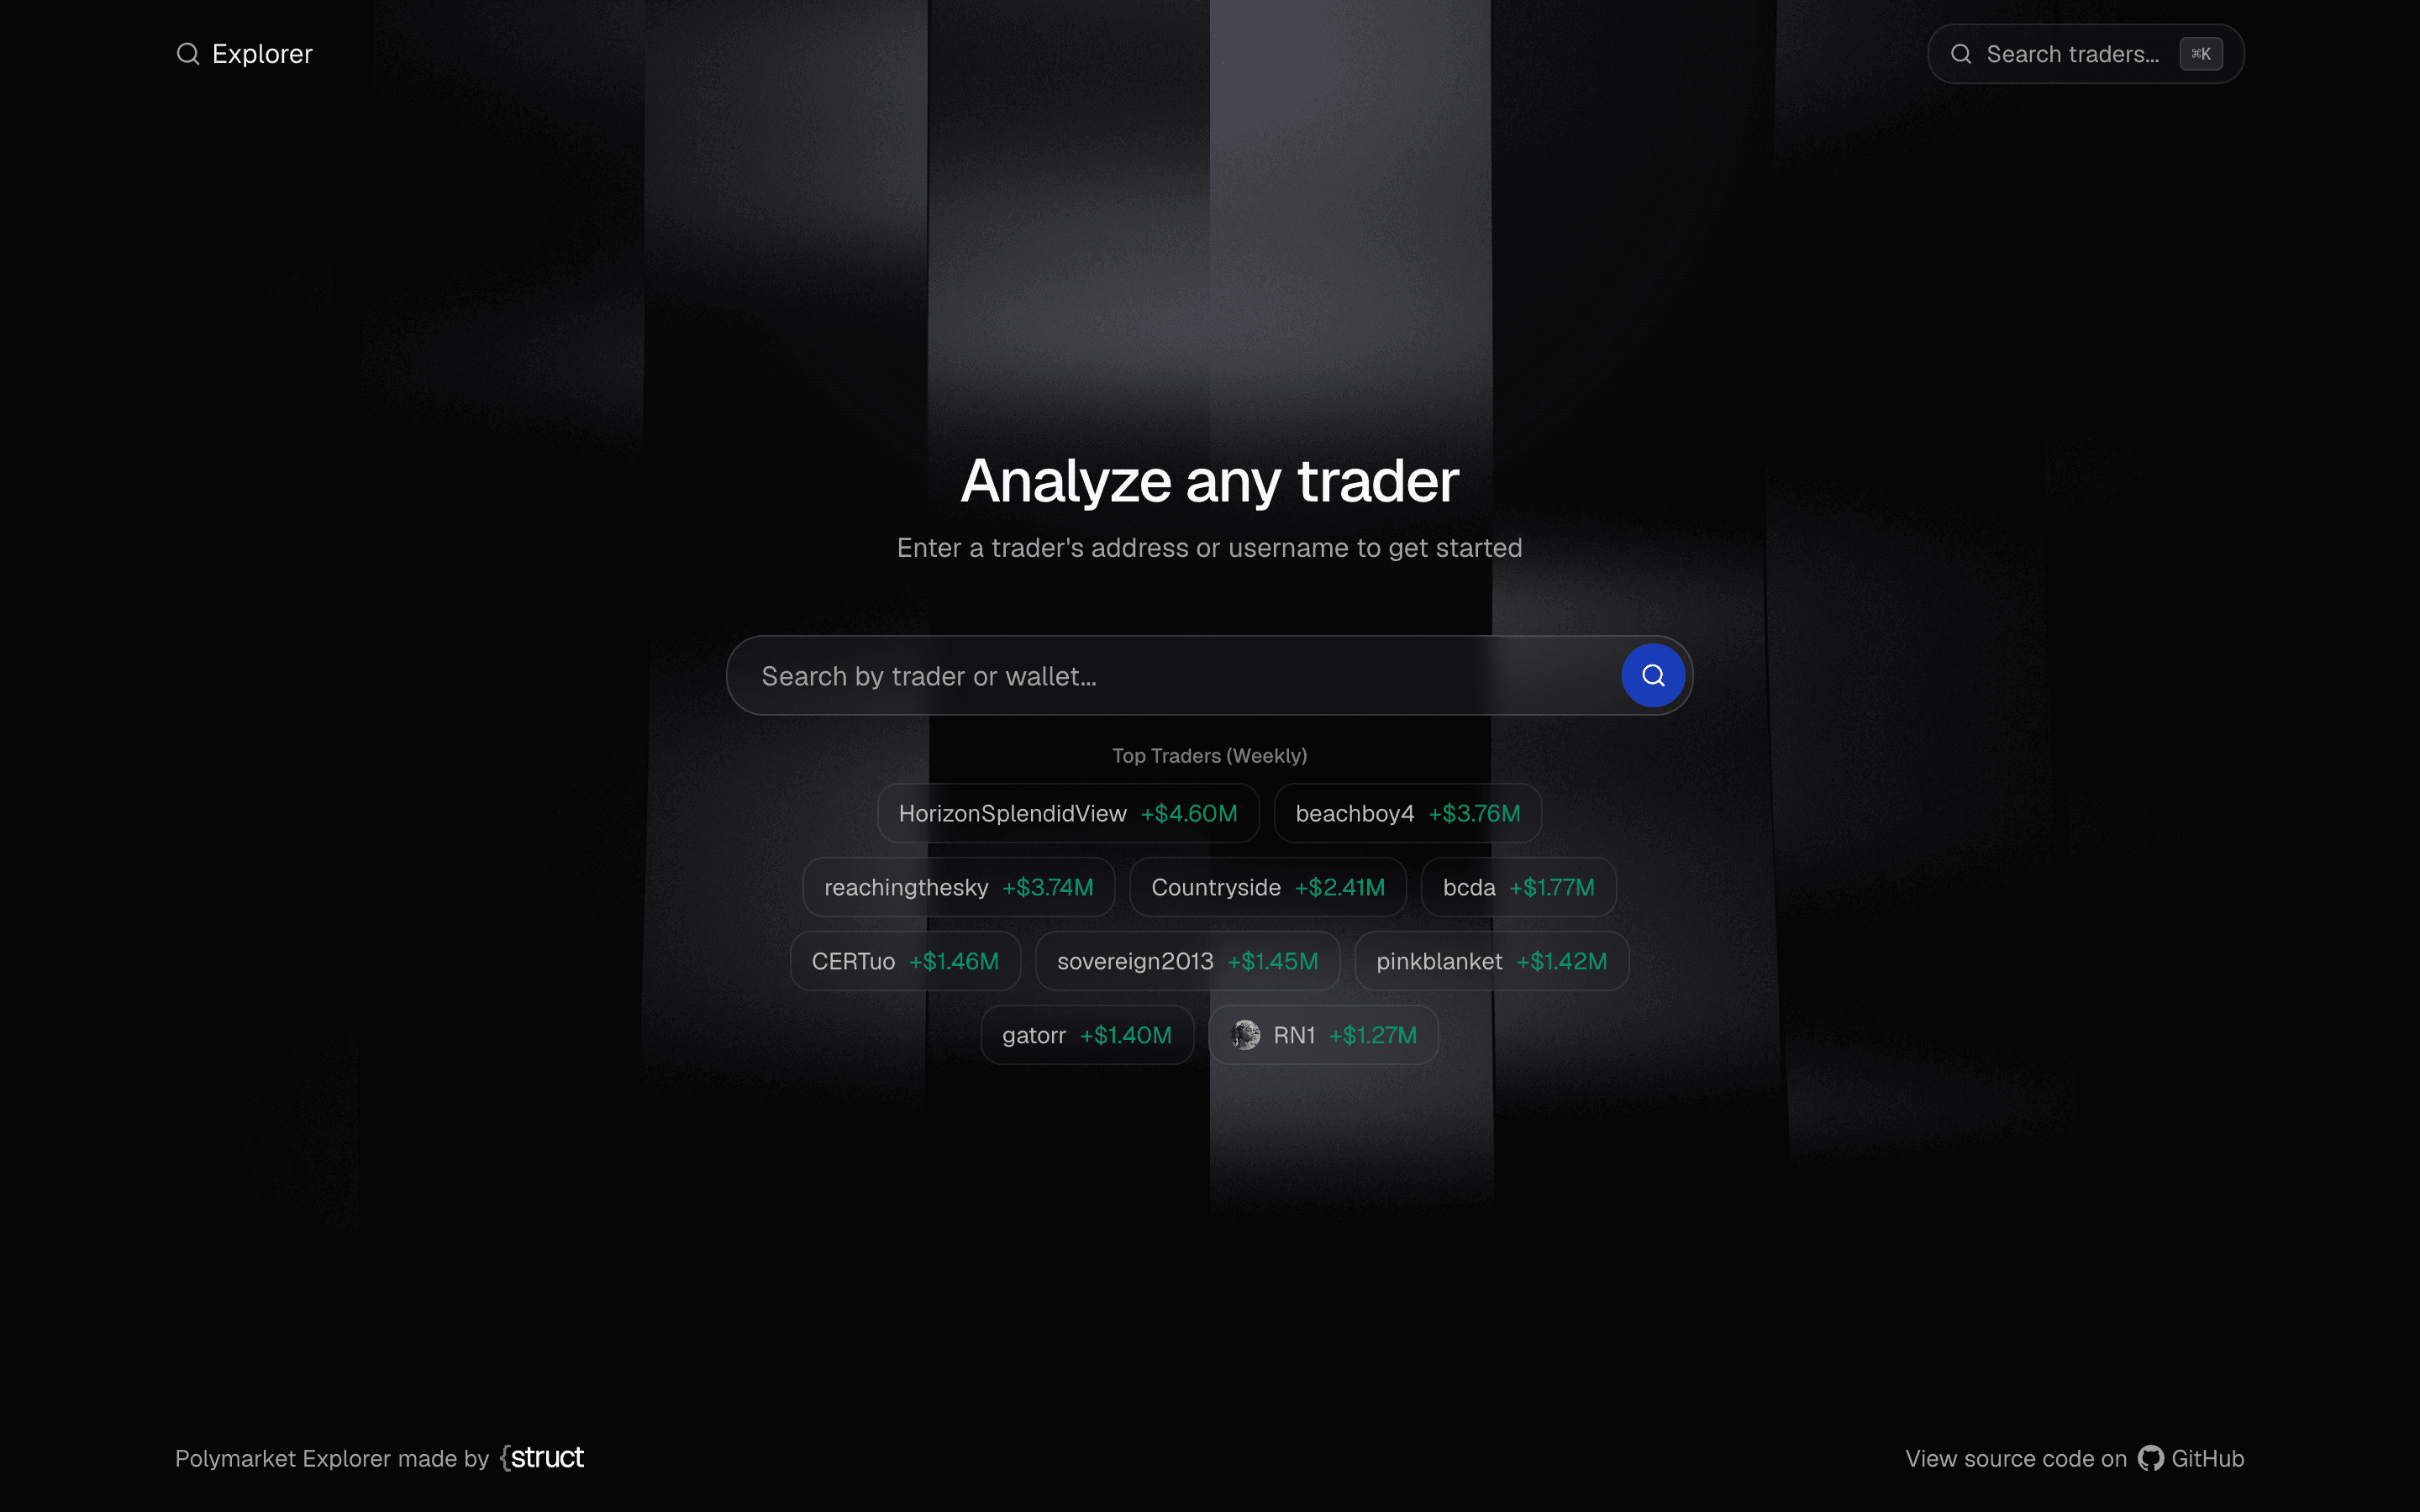
The leaderboard also feeds the dynamic sitemap - the top 20 traders are included as indexed pages with daily refresh frequency, giving them SEO visibility without manual curation.
Tech stack
| Layer | Technology |
|---|---|
| Framework | Next.js 16 (App Router, streaming SSR) |
| Data | Struct SDK |
| Charts | Recharts |
| Tables | TanStack Table |
| Image export | html-to-image |
| URL state | nuqs |
| 3D background | React Three Fiber |
| Styling | Tailwind CSS 4 + shadcn/ui |
| Fonts | Geist Sans & Mono |
Three runtime dependencies do the heavy lifting: the Struct SDK for all trader data, Recharts for the PnL chart, and TanStack Table for positions and activity. Everything else is standard Next.js with Tailwind.
Lessons learned
Fire all fetches in parallel, then stream. The trader page makes 5+ API calls. Running them sequentially would kill TTFB. Starting all promises before rendering and wrapping sections in Suspense means the browser gets the shell in under 100ms and content fills in as data arrives.
URL state beats React state for paginated views. Tabs, page numbers, and timeframes in the URL via nuqs means browser back/forward works, links are shareable, and there's no hydration mismatch between server and client.
Clone for image capture. Capturing a live DOM node leaks buttons and hover states into the image. Cloning into an off-screen container with data attributes for conditional styling keeps the live UI clean.
Prefetch intelligently, not eagerly. Waiting for idle, checking network conditions, and staggering requests means tab switches feel instant without penalising the first load.
limit + 1 is the simplest pagination. Request one extra row to know if there's a next page. No count queries needed.
Build your own
The project demonstrates a pattern that works for any analytics dashboard on Polymarket data:
- Search and discover - Struct SDK's full-text search for traders by name or wallet
- Fetch in parallel - Independent data sources loaded concurrently with Suspense streaming
- Visualise effectively - Charts, heatmaps, and tables that surface insights at a glance
- Share natively - High-DPI image export that works across browsers and devices
You could extend this into a portfolio tracker, a whale watching tool, a market research dashboard, or a trading signal generator. The data layer is the same - the only thing that changes is what you build on top.
The project is open source: github.com/structbuild/polymarket-explorer
Get a Struct API key - trader data access starts on the free plan